Wetterstation
Juli 2016
Inhaltsverzeichnis
- Wetterstation
- Indoor Datenlogging
Vor einer gefühlten Ewigkeit hab ich mal ein paar DS1820 1-Wire Temperatursensoren mit meinem Server verkabelt, um minütlich Innen- und Außentemperaturen zu loggen.
Das hat bisher immer gut geklappt. Diesen Sommer (2016) wollte ich das ganze Datenlogging Projekt mal etwas verbessern und ausweiten. Eigendlich sollte nur der Temperatursensor besser vor direkter Sonneneinstrahlung geschützt werden, andere Sensoren wie z.B. zum Messen von Luftdruck oder Feuchtigkeit usw kosten aber auch fast nichts mehr, also warum nicht gleich eine Wetterstation mit allen möglichen Messdaten?
Damit die Messdaten möglichst genau sind sollte die Station für draussen soweit wie möglich von der Hauswand weg stehen, die Sonne kann diese ganz schön erwärmen. Blieb die Frage, wie Daten übertragen und woher den Strom nehmen?
Zuerst wollte ich ein paar NRF24 2.4Ghz Funkmodule nehmen, da der Server mit direkt verkabeltem Empfänger aber hinter ein paar Wänden steht war die Verbindung doch zu schlecht. Aber da sind doch noch diese ESP8266 mit WLan und so. Der WLan Router wäre zumindest vom Garten aus gerade noch so zu erreichen.
Um die Station mit Strom zu versorgen könnte ich ein Kabel vom Kellerfenster bis zum anderen Ende des Gartens legen. Schlussendlich hab ich mich aber dagegen entschieden und angefangen, die Station möglichst Energeieffizient zu bauen, um auf 1S4P 18650 Li-Ion Zellen und einer Solarzelle zu laufen.
Mehrere Sendestationen, z.B. für Innenräume wären auch eine nette Sache, insbesondere, weil es keinen zusätzlichen Aufwand auf Serverseite bedeutet.
Am Server lät in einem Screen ein Python Script, welches per TCP Socket pro empfangenen Datensatz eine Zeile in eine Datei schreibt. Jede Station sendet z.B. pro Minute einmal die gemessenen Daten. Pro Tag wird eine neue Datei erstellt, beannt nach Jahr und Tag des Jahres (z.B. 2016311.txt). Einzelne Sensoren werden durch “,” getrennt. Die Formatierung übernimmt die jeweilige Messstation selbst, das Script schreibt blind die empfangenen Strings in eine Zeile bis die Verbdinung beendet wird. Am Anfang jeder Zeile wird zudem der Timestamp geschrieben.
Python Script: weatherESPserver_201608.py
Hier ein Beispiel:
1478390426,rssi0=-79,vbat0=3.82,tdht0=6.2,hum0=1.4,tbmp0=5.1,prs0=990.56,ldr0=60.2,uv0=1.05,tsky0=-12.44,rain0=0.000,wind0=49.0
1478390454,rssi1=-76,tdht1=21.2,hum1=46.8,tbmp1=20.9,prs1=990.38,ldr1=4.0,pir1=20
1478390491,rssi0=-78,vbat0=3.83,tdht0=6.1,hum0=1.4,tbmp0=5.1,prs0=990.64,ldr0=58.8,uv0=1.05,tsky0=-13.12,rain0=0.000,wind0=27.0
1478390514,rssi1=-75,tdht1=21.2,hum1=46.8,tbmp1=20.9,prs1=990.37,ldr1=1.9,pir1=80
1478390558,rssi0=-79,vbat0=3.82,tdht0=6.1,hum0=1.4,tbmp0=5.1,prs0=990.64,ldr0=57.1,uv0=1.05,tsky0=-13.02,rain0=0.000,wind0=27.0
1478390574,rssi1=-75,tdht1=21.2,hum1=46.9,tbmp1=20.9,prs1=990.43,ldr1=0.8,pir1=6
1478390622,rssi0=-78,vbat0=3.81,tdht0=6.1,hum0=1.4,tbmp0=5.1,prs0=990.63,ldr0=55.9,uv0=1.05,tsky0=-12.98,rain0=0.000,wind0=39.0
1478390635,rssi1=-76,tdht1=21.2,hum1=46.9,tbmp1=20.9,prs1=990.43,ldr1=0.7,pir1=0
1478390688,rssi0=-78,vbat0=3.83,tdht0=6.1,hum0=1.4,tbmp0=5.1,prs0=990.70,ldr0=57.7,uv0=1.04,tsky0=-12.62,rain0=0.000,wind0=37.0
1478390695,rssi1=-74,tdht1=21.2,hum1=46.9,tbmp1=20.9,prs1=990.43,ldr1=0.6,pir1=0
1478390753,rssi0=-77,vbat0=3.83,tdht0=6.1,hum0=1.4,tbmp0=5.1,prs0=990.71,ldr0=59.7,uv0=1.05,tsky0=-12.12,rain0=0.000,wind0=30.0
1478390755,rssi1=-73,tdht1=21.2,hum1=47.0,tbmp1=20.9,prs1=990.48,ldr1=0.6,pir1=0
1478390816,rssi1=-74,tdht1=21.2,hum1=46.9,tbmp1=20.9,prs1=990.56,ldr1=0.6,pir1=0
1478390818,rssi0=-79,vbat0=3.81,tdht0=6.1,hum0=1.4,tbmp0=5.1,prs0=990.67,ldr0=58.2,uv0=1.05,tsky0=-10.58,rain0=0.000,wind0=17.0
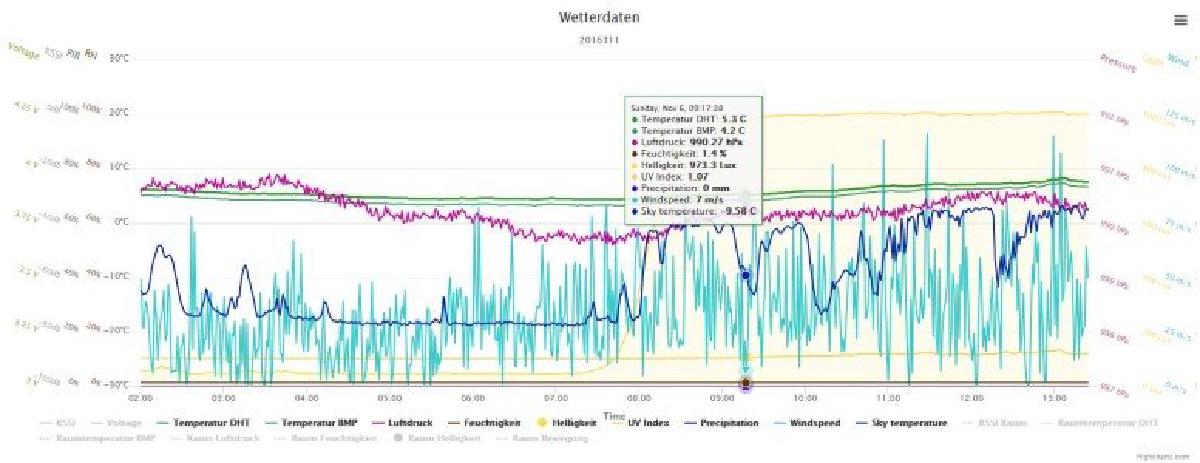
Um die Daten anzuzeigen hab ich etwas mit Highcharts rumgefrickelt.